Sumitomo Electric Wiring Systems · Toyota & PSA harnesses assembly lines

Production Leadership

Every topic below runs on one loop: plan with data, do it on the line, check the numbers, then act to make it the standard.

PPlanDDoCCheckAAct
PDCA · Shift Leader · Toyota and PSA harnesses assembly lines · Sumitomo Electric (SEWS-EG)

My Production Leadership Approach

Lead by the numbers, every hour

10
production lines led
≈410
operators per shift
+80
harnesses over plan, assembly lines WK45
+22
harnesses over plan, best assembly line WK45
PPlan

Weekly build plan turned into hourly targets per line, takt time per harness code and a staffing plan per station.

DDo

Track plan vs pack every hour on 10 assembly lines; fix material, kitting and manpower gaps on the spot.

CCheck

Weekly KPI review: productivity, defect ratio, defects per team and schedule adherence.

AAct

Good / bad points become an action plan and kaizen; zero-defect teams are recognized every week.

Weekly plan vs actual, best assembly line (harnesses)

PlanActual
WK34WK35WK36WK37WK38WK39WK40WK41WK42WK43WK44WK45
Plan met or beaten in all 12 weeks, with no gaps.
PDCA · Line balancing on the assembly lines

Breaking Bottlenecks

From 160 to 180 harnesses per shift

160 → 180
harnesses per shift
66% → 71%
line 1 efficiency
67% → 74%
line 2 efficiency
41% → 45%
line 3 efficiency
PPlan

Time study on the bottleneck harness (194 leads). To lift the line from 150 to 180 harnesses/shift, takt had to drop from 156 s to 130 s.

DDo

Split the bottleneck stations: PB 4 and PB 6 doubled, layup 2 and 5 split into A/B, tape 10 → 11 stations, clip 6 → 7, electric 2 → 3.

CCheck

Trial phase tracked daily plan vs actual until the line held 180 per shift with no bottleneck station left.

AAct

New build plan standardized: 43 → 50 operators, efficiency 66% → 71%. Same method applied to two more assembly lines.

Weekly plan vs actual (harnesses per shift)

PlanActual
W1W2W3W4W5W6W7W8W9W10W11W12W13W14W15W16W17W18W19W20W21W22W23W24W25W26
Plan met or beaten in all 26 weeks.
LineBeforeAfterChange
Line 1 (WH / shift)160180+20
Line 2, easy code (WH / shift)350370+20
Line 2, hard code (WH / shift)328345+17
Line 3, easy code (WH / shift)4347+4
Line 3: clip station split with a kitterCT 572 s > TT 558 sClip 1 + Clip 2bottleneck removed
PDCA · Hourly, daily and weekly KPI system for assembly lines

KPIs Drive Decisions

What gets measured gets fixed

91%
line OEE (94.9% × 98% × 97.9%)
0.07%
assembly lines DR in WK45 vs 0.5% target
9
zero-defect teams in one week
4.33σ
assembly lines sigma level (12-week avg DR 0.23%)
PPlan

Targets per line: plan per hour, defect ratio (0.5% target), productivity 100% and schedule adherence.

DDo

Hourly plan vs pack board per line; daily defect log per team; weekly KPI pack with good and bad points.

CCheck

Trend charts per line and per team flag the worst line and defect each week.

AAct

Worst-defect discussion → root cause → action owner; best teams ranked on defects, compliance and productivity.

Assembly lines defect ratio vs target (%)

Target 0.5%ActualOut of target
0.80%0.60%0.40%0.20%0.00%WK34WK35WK36WK37WK38WK39WK40WK41WK42WK43WK44WK450.63%
Only one week out of target in 12: WK40 at 0.63%. The RCA below closed it and every week since is under 0.5%.
WK40 out of targetAnalysis
What happenedWK40 defect ratio 0.63% vs 0.5% target; wrong-dimension defects made most of the spike.
WhereOne assembly line, right after a new team joined it (4M change: Man).
Why (5 Why)Wrong branch lengths → taped off the board marks → method not known → new operators worked alone → no shadow training planned for the team change.
Root cause4M change on manpower released without shadow training and without an extra dimension check.
CountermeasureNew team moved to shadow training; hourly dimension check on the line; 4M change form now requires a training plan.
ResultWK41 back to 0.22% and under target every week after; WK45 at 0.07%.
PDCA · Lean thinking on the Pipe line: material waste removed without touching quality

Cost Reduction Wins

≈ €23K saved every year

€9,048
per year, inverter-side shield
€4,800
per year, battery-side shield
€9,180
per year, NITTO tape
≈€23K
per year in total
PPlan

Measured actual material use per harness against the drawing: shields cut longer than needed and more tape issued than used.

DDo

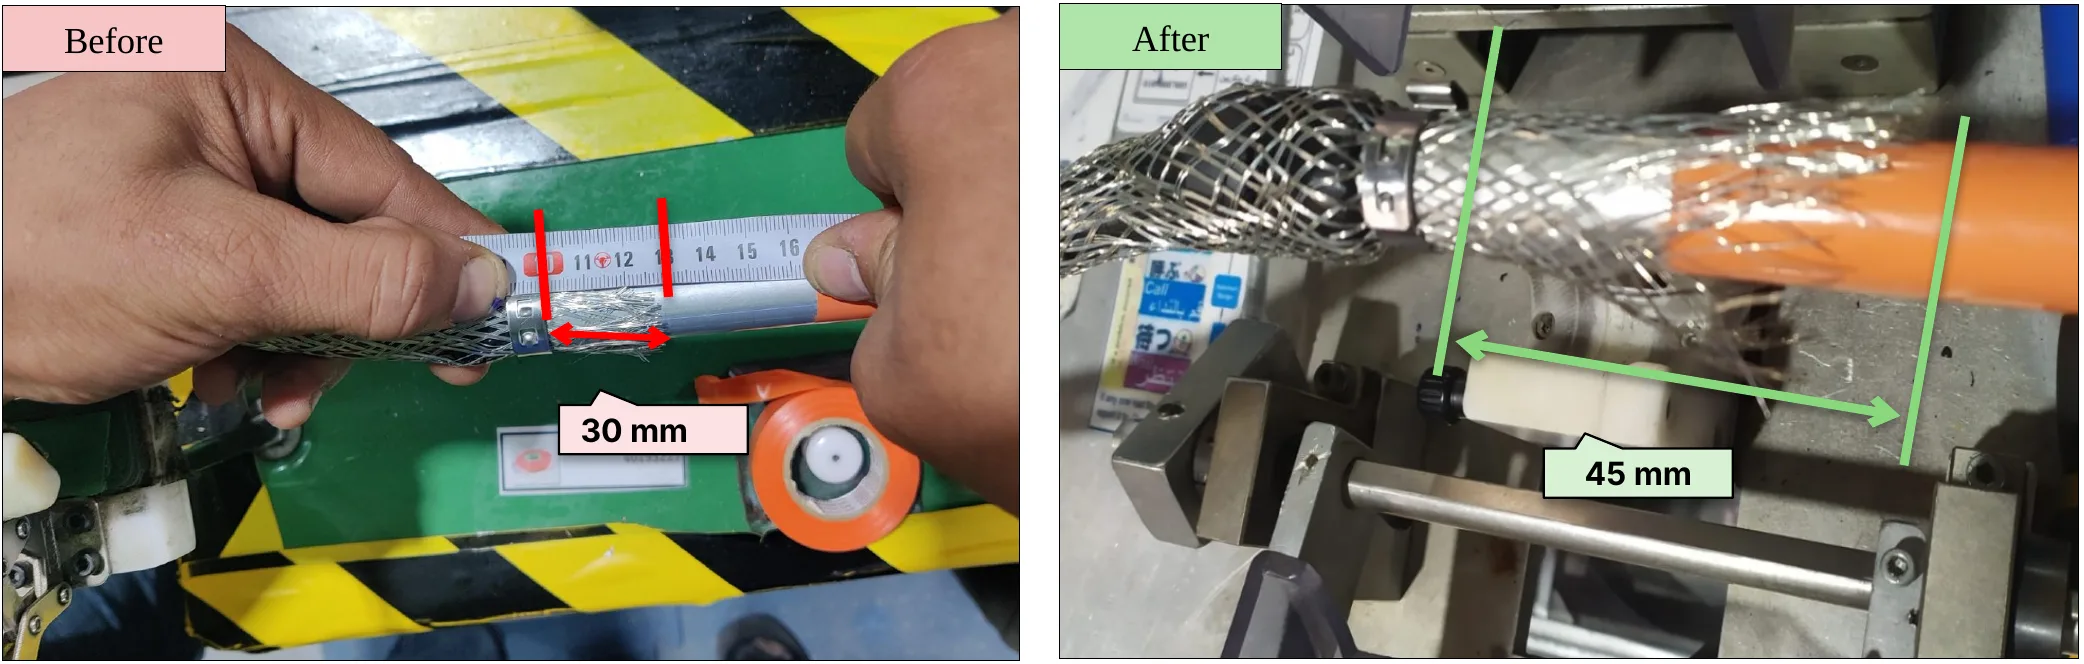
Inverter-side shield 700 → 665 mm, battery-side shield 180 → 165 mm (within ±5 mm), tape plan 43 → 39 rolls per shift.

CCheck

Battery cutter speed 3 → 1 made length repeatable (6 samples at 152–155 mm). Tape trial 1–19 Oct 2022 saved 60 rolls.

AAct

New lengths and tape plan made standard on all 3 shifts.

Yearly saving by item (EUR)

Inverter-side shieldBattery-side shieldNITTO tape
Inverter €9,048Battery €4,800€13,848€9,180Shield (inverter + battery side)NITTO tape
Value added vs non-value added

The customer pays for the shield length on the drawing. Every millimetre cut beyond it, and every roll of tape issued but not used, is non-value-added material the customer never pays for. Trimming to the drawing (±5 mm) kept all the value-added material and removed only the waste, without touching quality.

For the Toyota customer
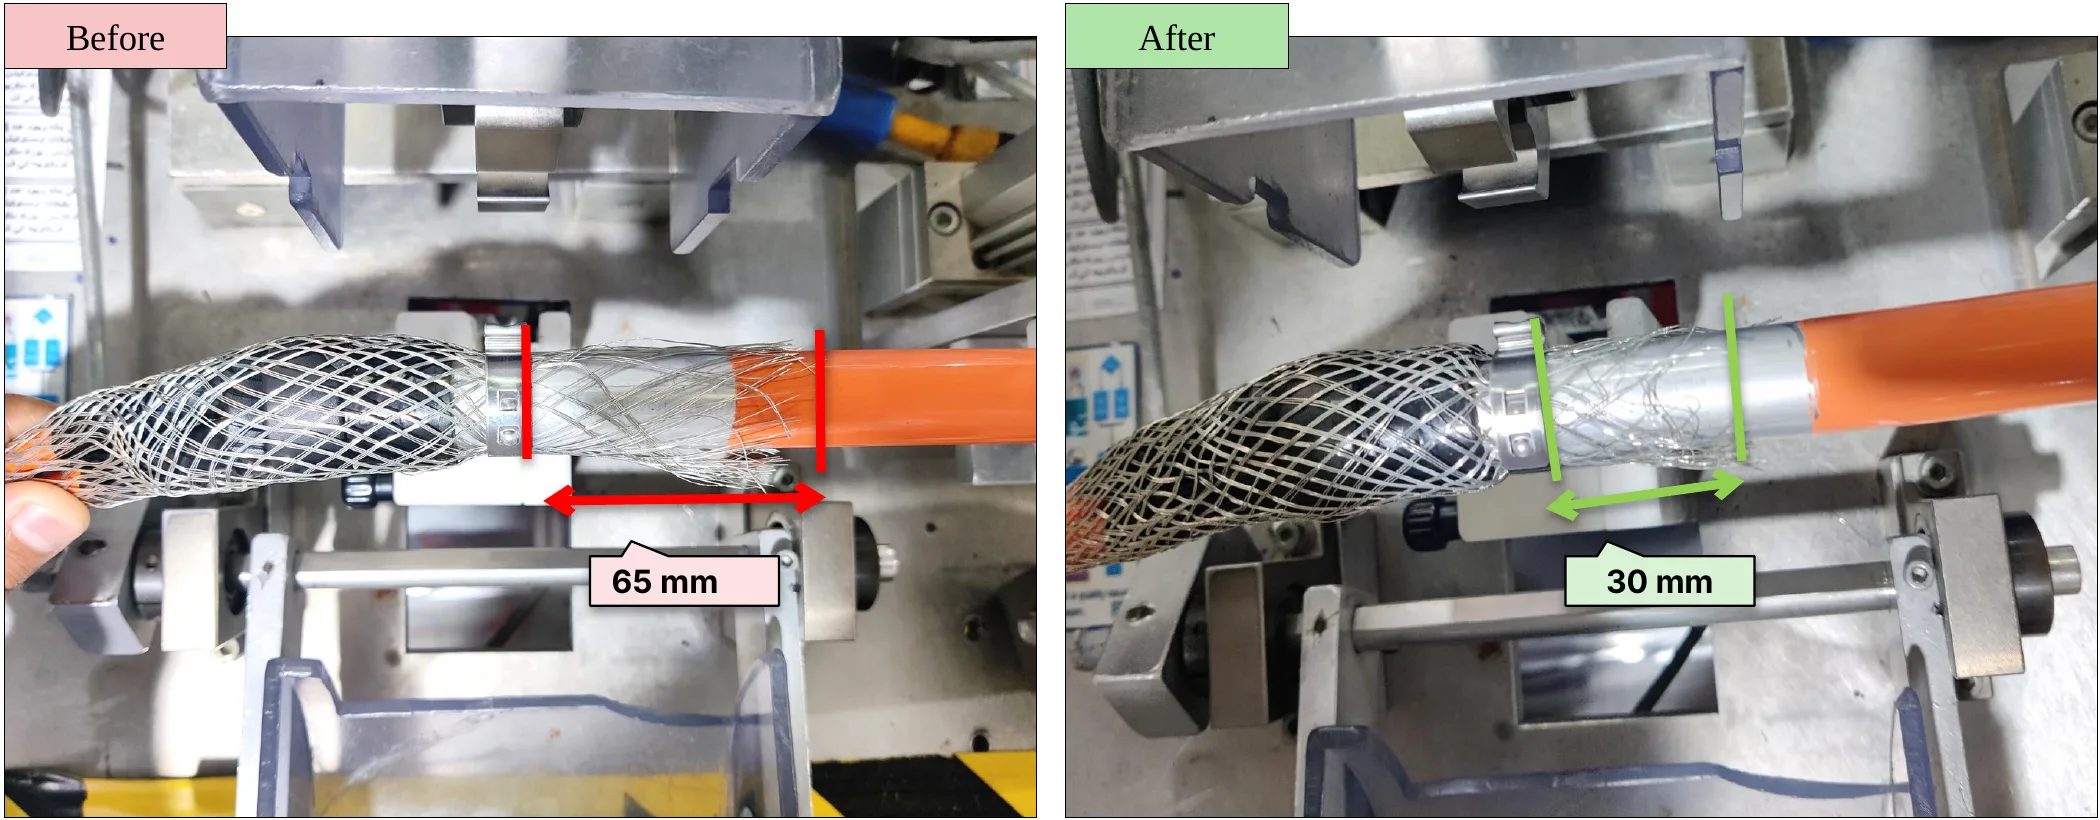
Inverter-side shield: before / after, cut 700 → 665 mm
Battery-side shield: before / after, cut 180 → 165 mm
ItemPer harnessPer dayPer month
Shield (inverter + battery side)50 mm38.4 m999 m
NITTO tape—12 rolls312 rolls
PDCA · A weekly 5S / lean audit and a kitting-area turnaround

5S Actions

A place for everything, and stock for every part

16
audit points per line
5
S pillars checked weekly
0
useless parts left in kitting
Stocked
every kitting part after the cleanup
PPlan

16-point lean audit across Sort, Set in order, Shine, Standardize and Sustain, run by each team leader.

DDo

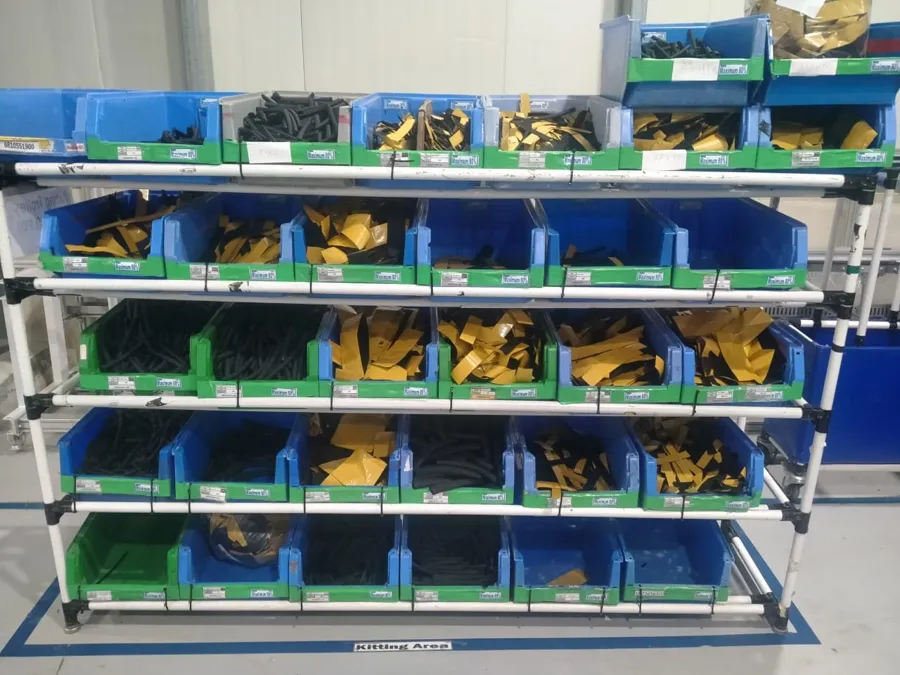
PDB Left kitting area: removed useless parts, labeled locations, set a stock level for every part.

CCheck

Weekly audit judgement per point; line stoppages from missing parts tracked.

AAct

Before / after pictures displayed as success stories; audit points rolled out to the other lines.

16-point lean audit
S1 Sort4 ptsNo unnecessary items; storage area defined and clear
S2 Set in order5 ptsClear, labeled locations; no sharp edges on material
S3 Shine3 ptsFloors, racks and stored items kept clean
S4 Standardize2 ptsChecklists, PFUs and MOMs defined and used
S5 Sustain2 pts5S as a way of life; before / after shown
Kitting rack after the 5S cleanup: only needed parts, every part stocked
After the cleanup: only needed parts, every part stocked
PDCA · Process FMEA on the Pipe line, built from real defect modes

FMEA: Preventing Failures

Rank the risk, fix the biggest first

6
failure modes ranked
210 → 84
highest RPN, before → after (example)
1–10
S / O / D rating scale
4M
every change triggers a review
PPlan

List each station's failure modes from the defect log; rate Severity, Occurrence and Detection (1–10).

DDo

Act on the highest RPN first: rubber edges on the conveyor, jig gauges, operator method at insertion.

CCheck

Re-rate O and D after the action and confirm with the weekly defect count.

AAct

Update the control plan and work instructions; review the PFMEA at every 4M change.

StationFailure modeSODRPNActionRPN after
InsertionDamage component765210Fix harness to stand at insertion; rubber on conveyor edges84
Electric / Bat.2Wrong dimension664144Gauge on jig; hourly check54
Test boardTerminal back-out936162Stop & repair board; detection jig36
BenderWrong component orientation745140Position mark on jig42
InsertionScratched pipe555125Rubber on conveyor edges40
Bender / Elec.Open bracket644964M change control36

Risk priority number, before vs after

BeforeAfter
Damage component
210
84
Wrong dimension
144
54
Terminal back-out
162
36
Wrong component orientation
140
42
Scratched pipe
125
40
Open bracket
96
36

Example worksheet: failure modes come from the Pipe line defect log; S/O/D ratings are illustrative.