Production Leadership
Every topic below runs on one loop: plan with data, do it on the line, check the numbers, then act to make it the standard.
My Production Leadership Approach
Lead by the numbers, every hour
Weekly build plan turned into hourly targets per line, takt time per harness code and a staffing plan per station.
Track plan vs pack every hour on 10 assembly lines; fix material, kitting and manpower gaps on the spot.
Weekly KPI review: productivity, defect ratio, defects per team and schedule adherence.
Good / bad points become an action plan and kaizen; zero-defect teams are recognized every week.
Weekly plan vs actual, best assembly line (harnesses)
Breaking Bottlenecks
From 160 to 180 harnesses per shift
Time study on the bottleneck harness (194 leads). To lift the line from 150 to 180 harnesses/shift, takt had to drop from 156 s to 130 s.
Split the bottleneck stations: PB 4 and PB 6 doubled, layup 2 and 5 split into A/B, tape 10 → 11 stations, clip 6 → 7, electric 2 → 3.
Trial phase tracked daily plan vs actual until the line held 180 per shift with no bottleneck station left.
New build plan standardized: 43 → 50 operators, efficiency 66% → 71%. Same method applied to two more assembly lines.
Weekly plan vs actual (harnesses per shift)
KPIs Drive Decisions
What gets measured gets fixed
Targets per line: plan per hour, defect ratio (0.5% target), productivity 100% and schedule adherence.
Hourly plan vs pack board per line; daily defect log per team; weekly KPI pack with good and bad points.
Trend charts per line and per team flag the worst line and defect each week.
Worst-defect discussion → root cause → action owner; best teams ranked on defects, compliance and productivity.
Assembly lines defect ratio vs target (%)
Cost Reduction Wins
≈ €23K saved every year
Measured actual material use per harness against the drawing: shields cut longer than needed and more tape issued than used.
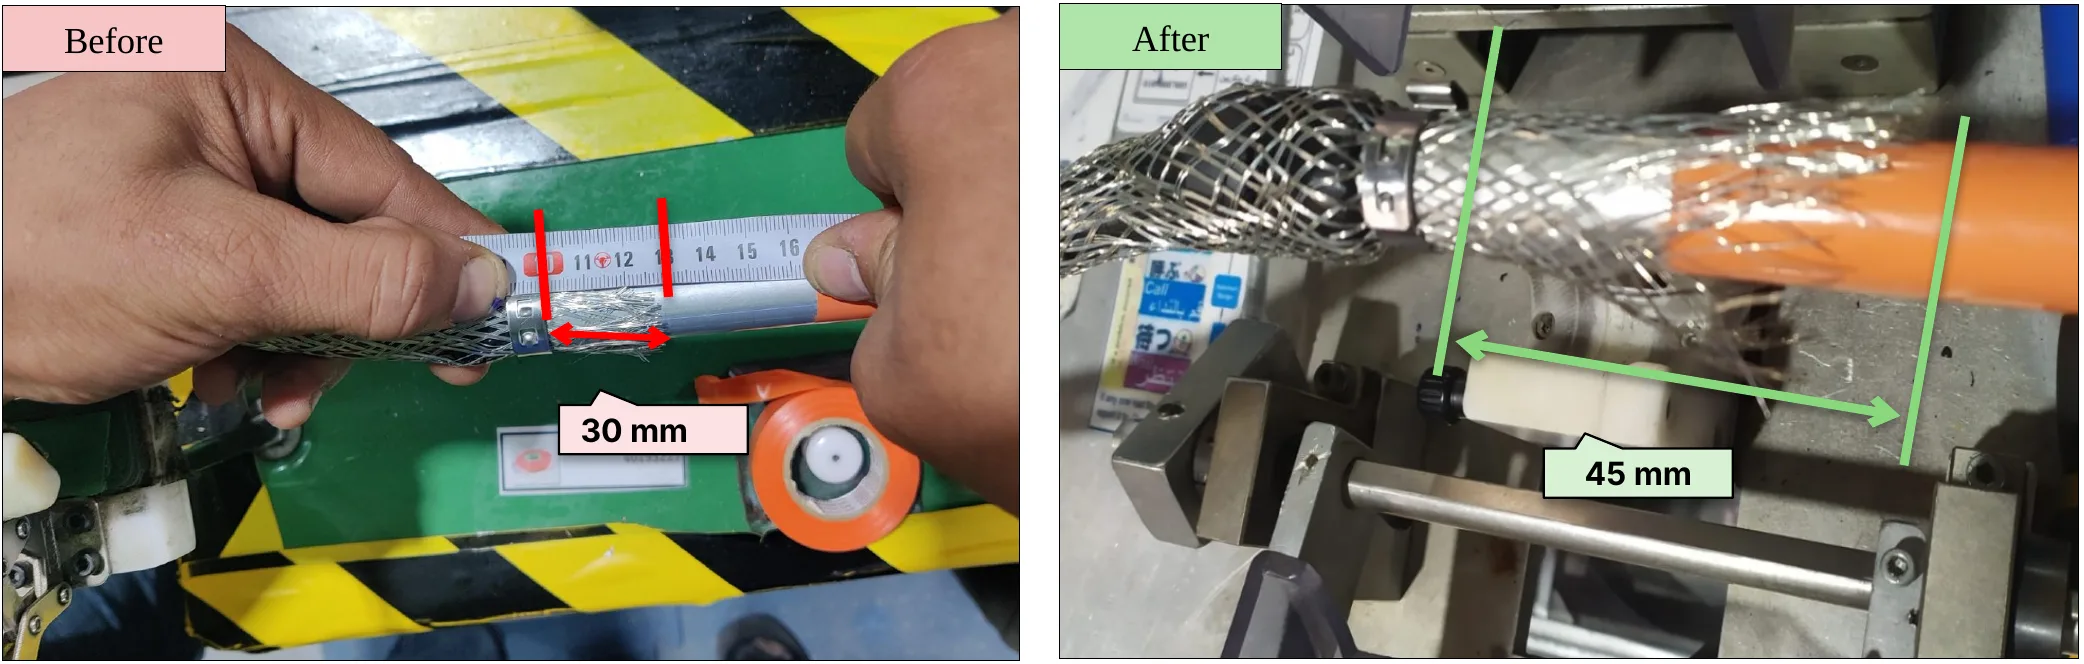
Inverter-side shield 700 → 665 mm, battery-side shield 180 → 165 mm (within ±5 mm), tape plan 43 → 39 rolls per shift.
Battery cutter speed 3 → 1 made length repeatable (6 samples at 152–155 mm). Tape trial 1–19 Oct 2022 saved 60 rolls.
New lengths and tape plan made standard on all 3 shifts.
Yearly saving by item (EUR)
The customer pays for the shield length on the drawing. Every millimetre cut beyond it, and every roll of tape issued but not used, is non-value-added material the customer never pays for. Trimming to the drawing (±5 mm) kept all the value-added material and removed only the waste, without touching quality.
For the Toyota customer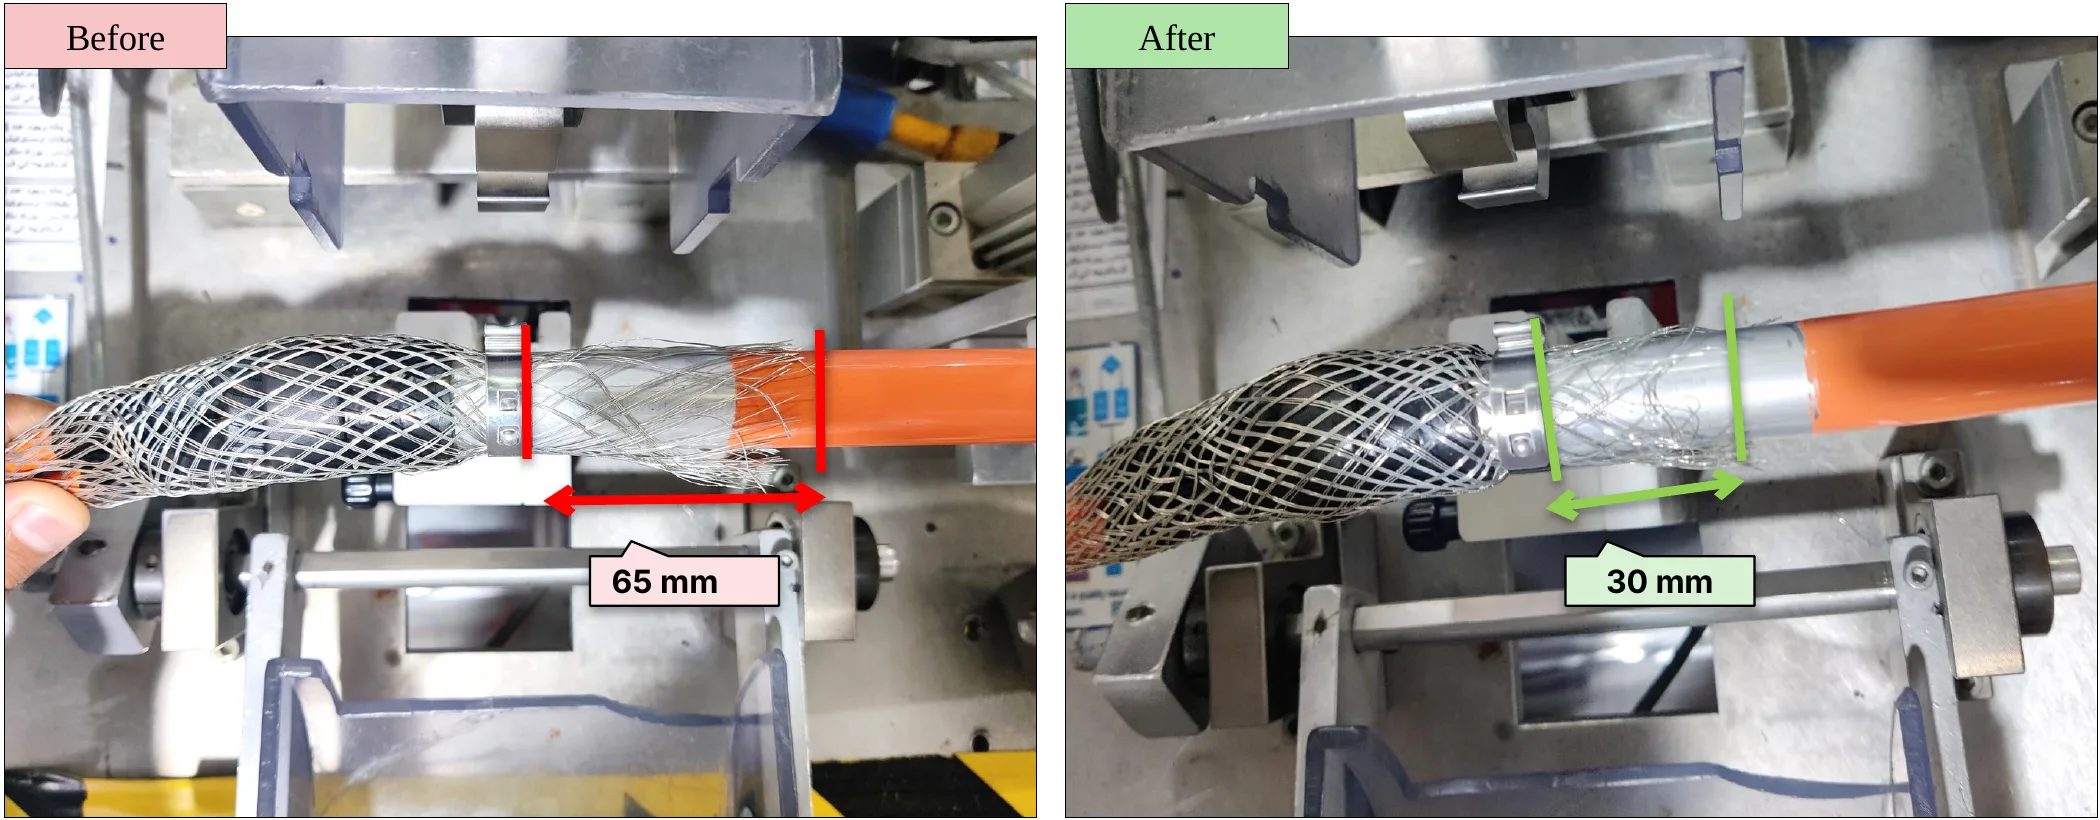
5S Actions
A place for everything, and stock for every part
16-point lean audit across Sort, Set in order, Shine, Standardize and Sustain, run by each team leader.
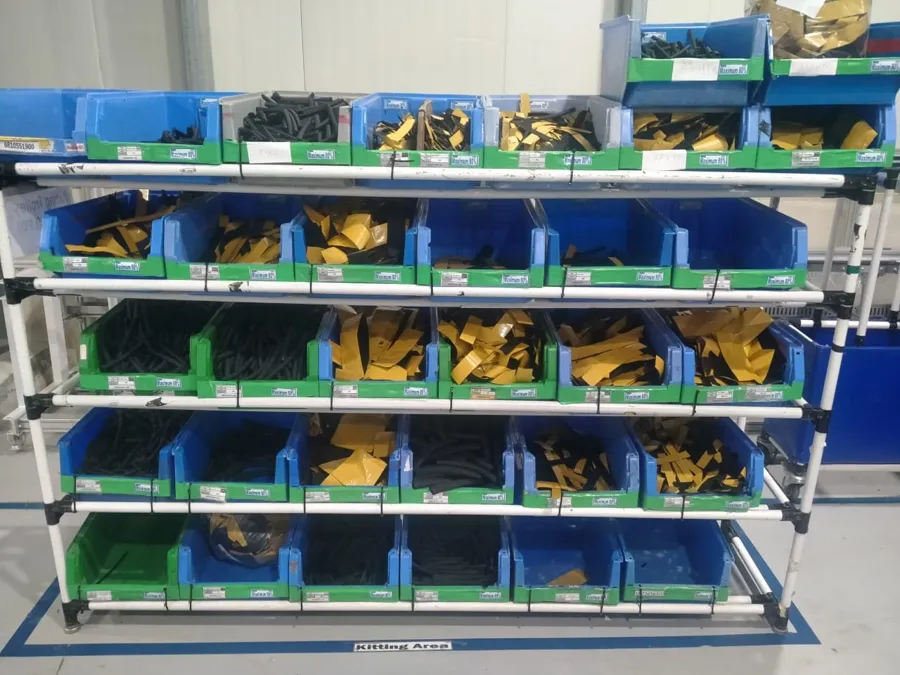
PDB Left kitting area: removed useless parts, labeled locations, set a stock level for every part.
Weekly audit judgement per point; line stoppages from missing parts tracked.
Before / after pictures displayed as success stories; audit points rolled out to the other lines.
16-point lean audit
FMEA: Preventing Failures
Rank the risk, fix the biggest first
List each station's failure modes from the defect log; rate Severity, Occurrence and Detection (1–10).
Act on the highest RPN first: rubber edges on the conveyor, jig gauges, operator method at insertion.
Re-rate O and D after the action and confirm with the weekly defect count.
Update the control plan and work instructions; review the PFMEA at every 4M change.
Risk priority number, before vs after
Example worksheet: failure modes come from the Pipe line defect log; S/O/D ratings are illustrative.